Background
If you’ve spent any time on this site, you’re likely familiar with the Equation of Exchange, MV = PQ.
This simple equation, first derived by John Stuart Mill and later popularized by Milton Friedman is the foundation of all our work.
The equation of exchange can be applied at a high level to quickly calculate price floors of a currency based on a few inputs or assumptions.
It can also be applied at a micro-level to tweak the economics and incentives of a cryptocurrency or token for maximum value capture.
If any of these terms are unfamiliar, you can refer to the Glossary page for their definitions.
Goals of this project
- Token analysis script
- Token flow visualization
- Token engineering framework
Token economic analysis
The first goal of this project is to create a script that parses transaction data of a given cryptocurrency or token in order to find components of its price floor according to the equation of exchange, MV = PQ.
Simple pulls include contract events and token transactions that take place within the token protocol to find PQ. Calculated components include circulating supply and address balances over time to find V.
Token flow model
Using variants of the equation of exchange, token flow can be modeled within an ecosystem.
A novel way to do this is by using a Sankey diagram.
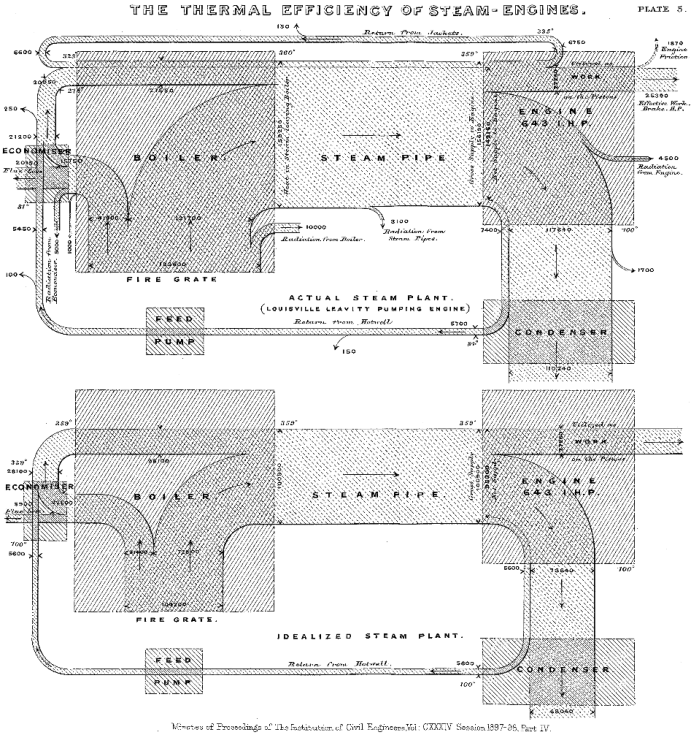
The Sankey diagram takes its name from Irish Captain Matthew Sankey, who used it to model the energy efficiency of a steam engine.
Sankey compared the real energy efficiency of an engine to its ideal efficiency.
While Sankey was interested in energy efficiency, we are interested in value capture.
Value is most commonly captured by tokens when they are used as a medium of exchange, denominated in another separate unit of account – e.g. an expenditure of $10,000 worth of Bitcoin.
Components in a token flow diagram
Objects in a token flow diagram represent participants in the ecosystem within which a token circulates.
Value transferred via transactions is represented by the connections in between.
The dimensions (height x width x length = volume) of the “pipes” representing these connections represent:
- Tokens circulating in an ecosystem (circulating supply)
- The value transferred between participants in an ecosystem (PQ)
- The time a token takes to circulate, represented by length of all pipes (V)
Token flow diagrams denominated in native units (e.g. BTC) and those denominated in another unit of account (dollars) can be overlayed to solve for the price floor of each unit.
In this way, token flow diagrams become a visual aid in calculating price floors.
Token economic engineering
Sankey diagrams are fitting for token flow visualization for more than one reason.
Sankey’s hallmark example of a steam engine makes for an excellent analogy to token ecosystems for our purposes of designing and refining the token economics of a protocol, token economic engineering.
Like steam engines, cryptocurrency protocols have mechanisms which direct the flow and efficiency of energy.
In our models, energy is economic “potential” energy, represented by tokens with purchasing power.
Keeping with the steam engine analogy, the “goal” of token economic engineering is to first to increase the volume of the pipes, and second to decrease the number of tokens flowing through them.
We discuss various ways to do this on Telegram, and we collaborate with each other in reaching the goals described above.
If you’d like to collaborate, send a message to @EatSleepCrypto on Twitter for an invite.